Deep Neural Networks are black-boxes: they map some input to some output, and we can make them do this surprisingly well. However, we usually have no idea how this mapping works. Particularly Convolutional Neural Networks (CNNs), which employ “convolutions” as filters, achieved some impressive results (before Vision Transformers came along).
Filter Visualization can help us understand what kind of patterns the convolutional filters in CNNs detect.
Why would we want to do it? §
Visualizing filters can help us to get an understanding of what the neural network is doing. The method can also be used to identify filters that are not required for the model, because they are redundant copies of other filters, or compute not valuable features at all.
How does it work? §
Filter visualization aims to find the input $x$ that activates a certain convolutional filter the most. Mathematically, this means we are solving $$ \arg \max_x \mathcal{L} (f(x)) = \sqrt{\sum_i \sum_j f(x)_{ij}^2} $$
where $f(x)_{ij}$ refers to the value at position $i,j$ in the feature map (the output of the filter) computed by $f$.
In practice, we solve this optimization problem via gradient descent (or, in this case, ascend, since we aim to maximize the activation). That is: we start with a randomly initialized input, $x$, calculate the gradient of the magnitude of the filter activation $\nabla_x \mathcal{L}$, and iteratively update $x$ to increase the magnitude:
$$ x’ = x + \alpha \nabla_x \mathcal{L}(f(x)) . $$
Additionally, we normalize the gradient during updates for stability.
layer = net.conv1 # this is the layer we are targeting
filter_no = 5 # the index of the filter we are targeting
alpha =  0.01  # learning rate

x = torch.randn(size=(3,256,256))

x_v = Variable(x.unsqueeze(0)).cuda(), # size will be BxCxHxW
x_v.requires_grad = True # enable grad to include in backprop

for i in range(50):
   # gradient ascend iteration
   out = layer(x_v)  # size will be BxCxHxW
   f = out[0, filter_no] # select filter by index, size will be HxW

   loss = f.pow(2).sum().sqrt()

    # zero grads
    if x_v.grad is not None:
      x_v.grad.data = torch.zeros_like(x_v.grad.data)

   loss.backward()

   with torch.no_grad():
      # gradient normalization and upate
      x_v.grad /= x_v.grad.pow(2).mean().sqrt() + 0.000001
      x_v += x_v.grad * alpha
Results §
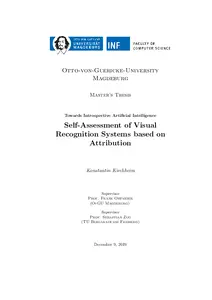
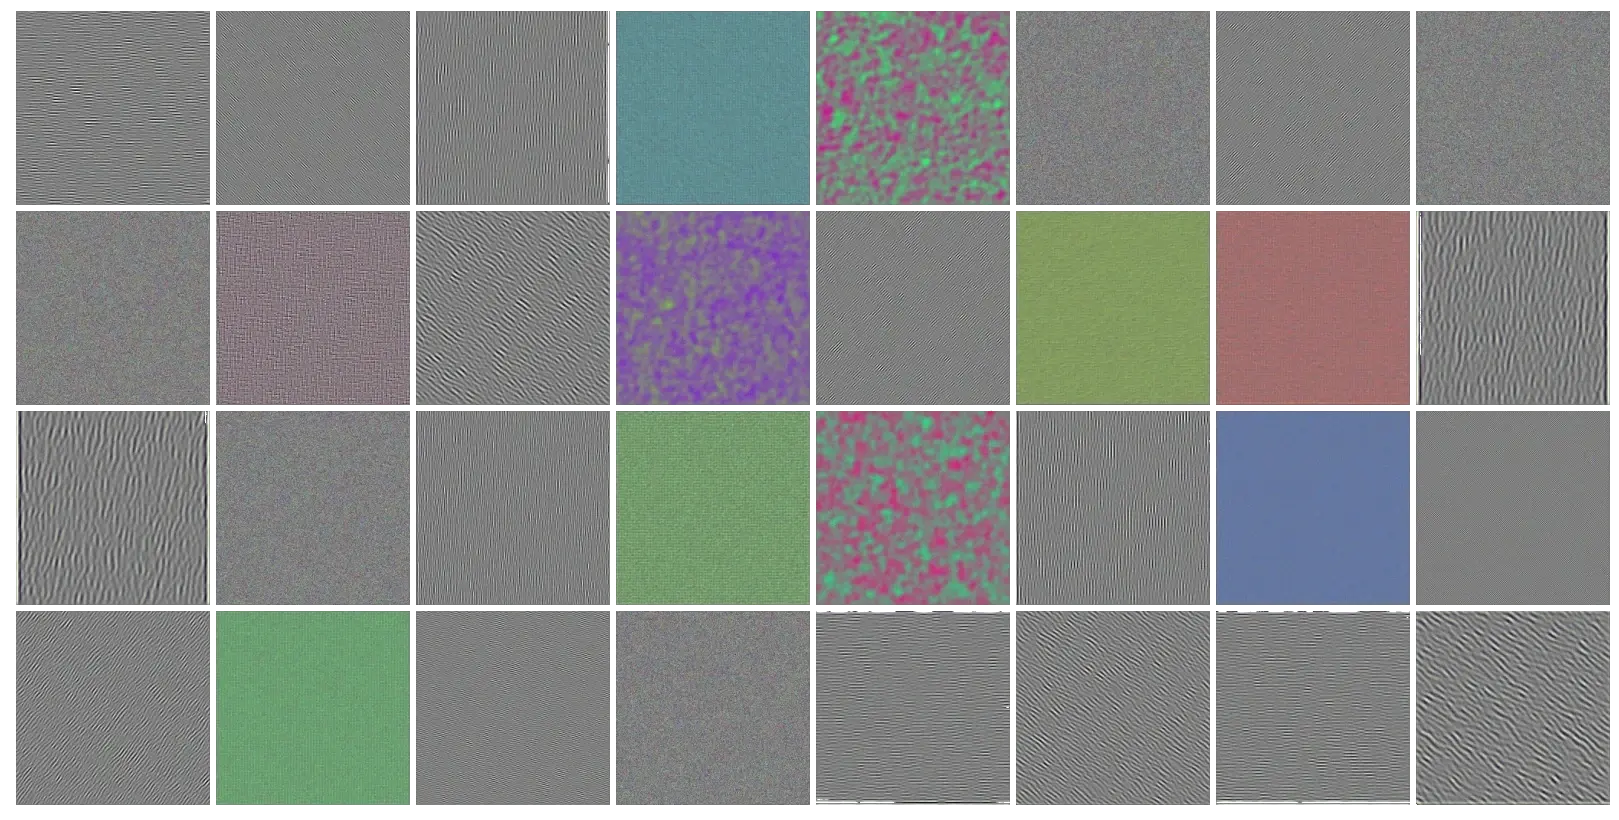
What we observe is that, the deeper we go, the more abstract the features become. While the lower features - lines with different orientations, certain colors, and color blobs - are comparatively straightforward to intepret, guessing the meaning of the lower-level features feels more like a Rorschach test.
Filter visualization of the first convolutional layer of a ResNet 101
These observations are evidence for the hypothesis that neural networks learn increasingly abstract, high-level features in upper layers. On the other hand, this also means that we can not really get an understanding of what these lower layers are doing.
Filter visualization of the last layer of a ResNet 101